Exploring Montco with Census Data
The US Census website makes public all the data the Census captures, which is really useful for market research, especially if you operate a business that serves local customers.
You can see which towns are becoming wealthier, which ones have more young / old people, which towns have more renters or business owners or retail workers. The list goes on. For a small business looking to maximize its marketing dollars, there’s a lot of good data there to guide the decisions of how, where and when you might want to market a product or service to a local audience.
Although the data is good, the Census website itself is a little difficult to navigate. There are a lot of tables with outdated info, big data-sheets, and no easy way to pull out any sort of meaningful trends.
I was exploring this problem when I came across an app called Maptitude by Caliper.
Maptitude is a desktop application that takes Census data and plots it on a map in a way that’s much more intuitive than the Census website. You can select a field (like “population”) and see a density map of population of all the zip codes in your view. You can also combine fields and build formulas to reveal insights like what areas have the least competition for your business and might be good for you to start advertising in
Here’s a little video I did on using it:
I spent some time exploring this tool and since my business is in Collegeville I looked in the MontCo area.
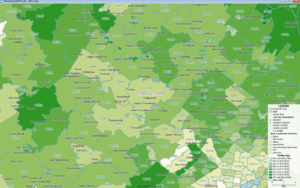
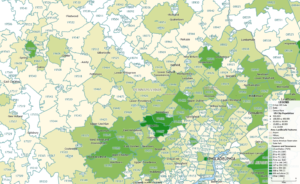
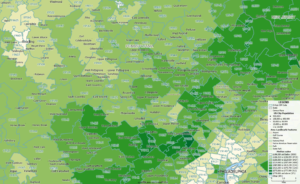
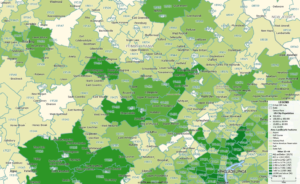
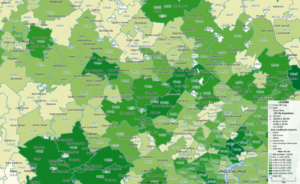
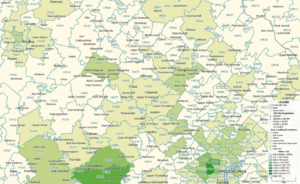
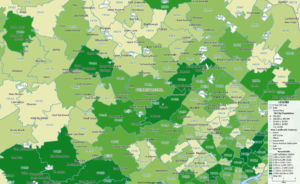
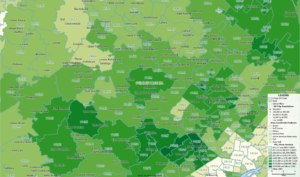
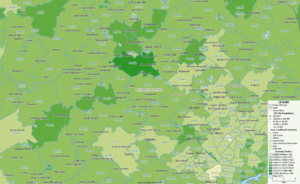
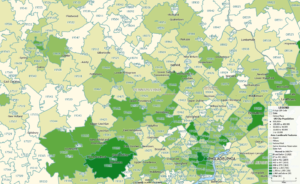
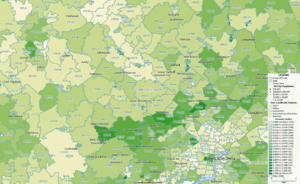
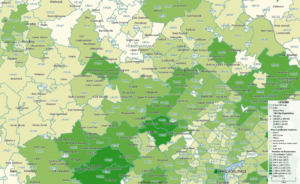
The maps below show some cool insights that I learned and wanted to share (click on any map to see full size).
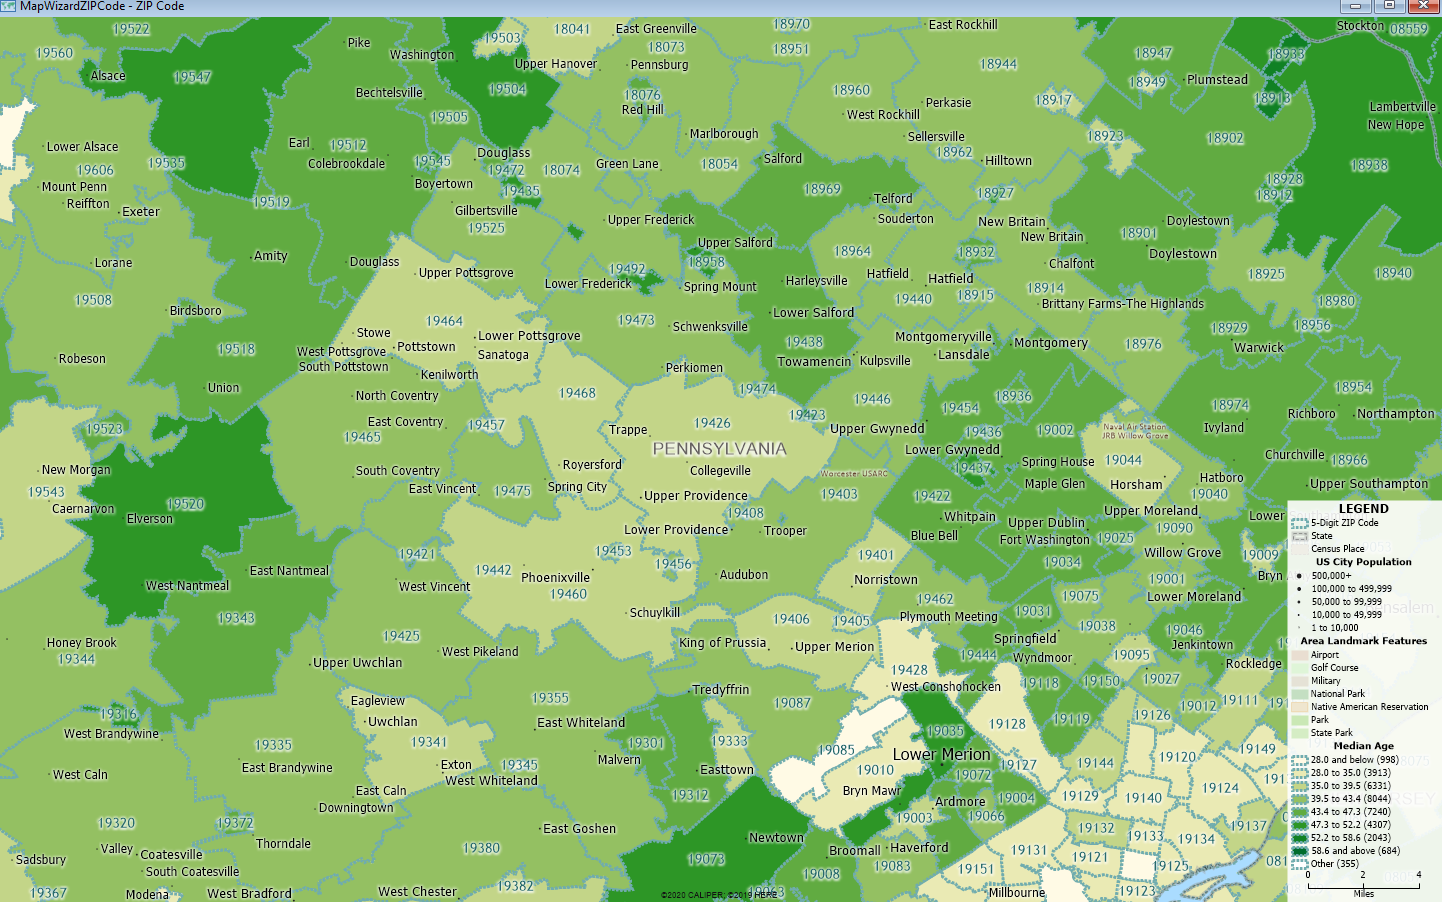
Average Age
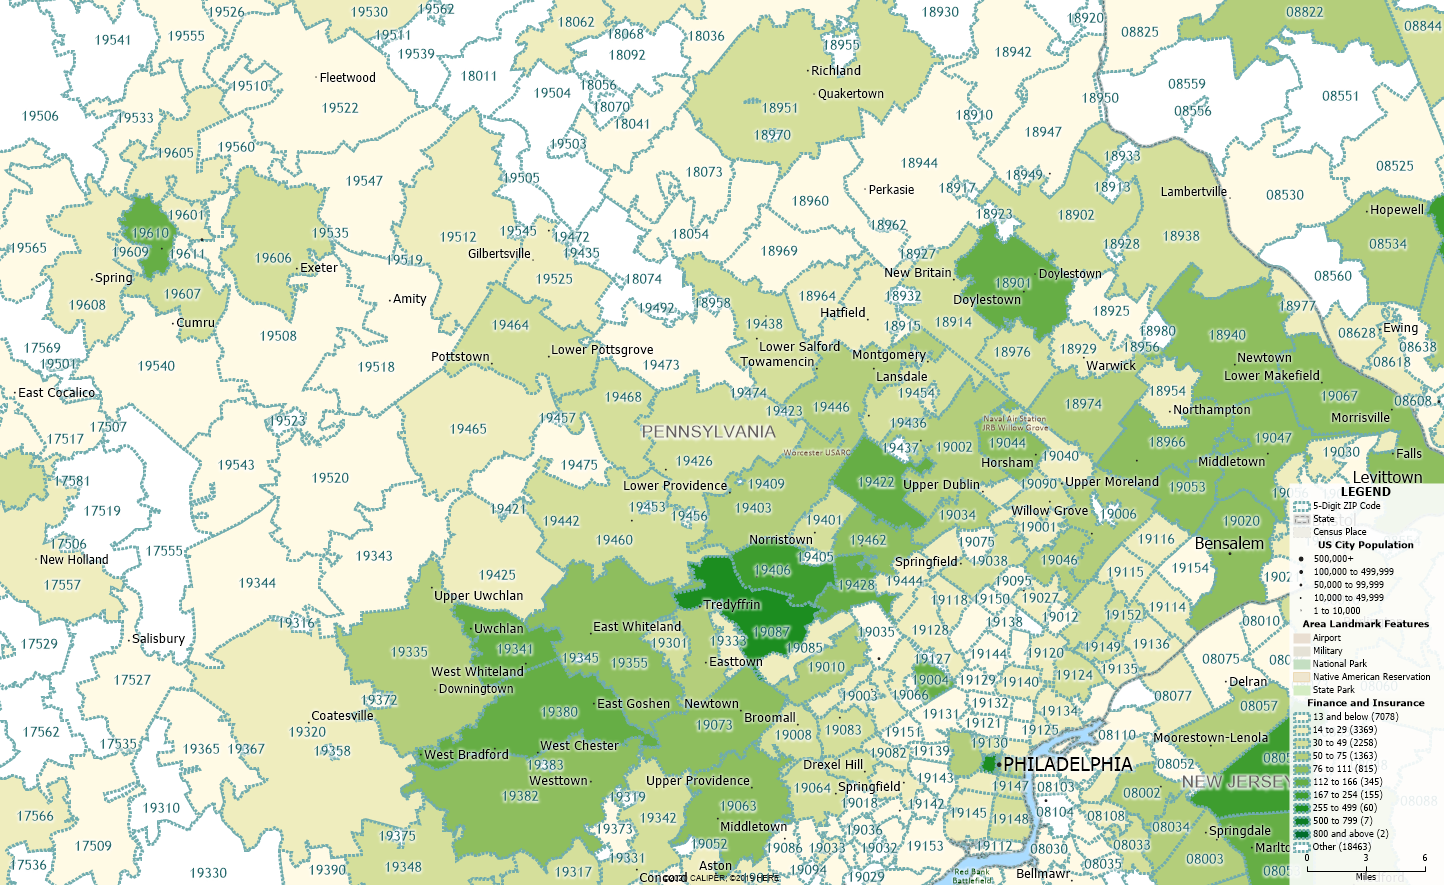
Number of Financed and Insured businesses
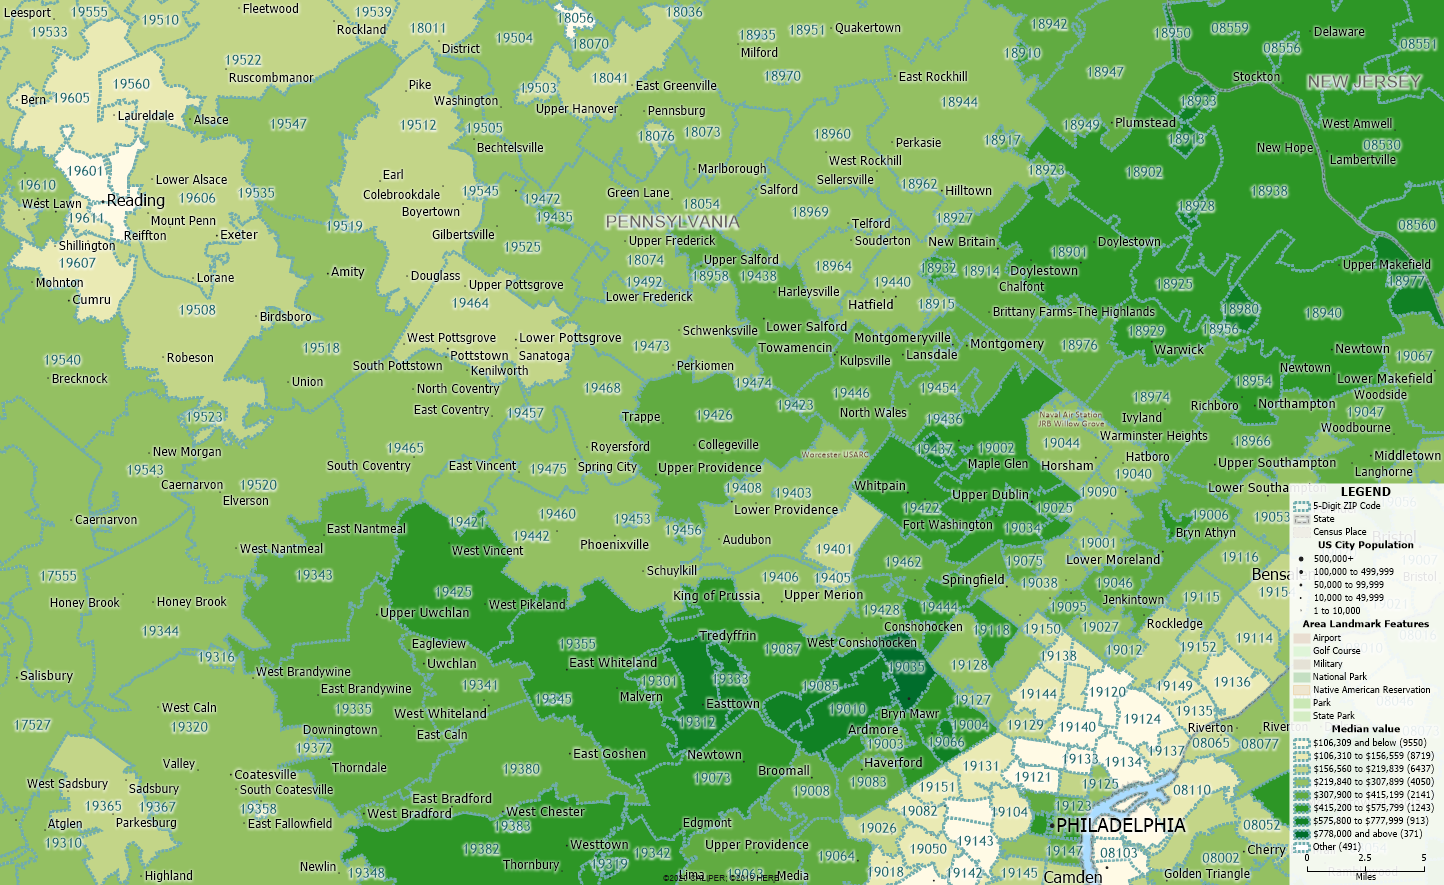
Home Value
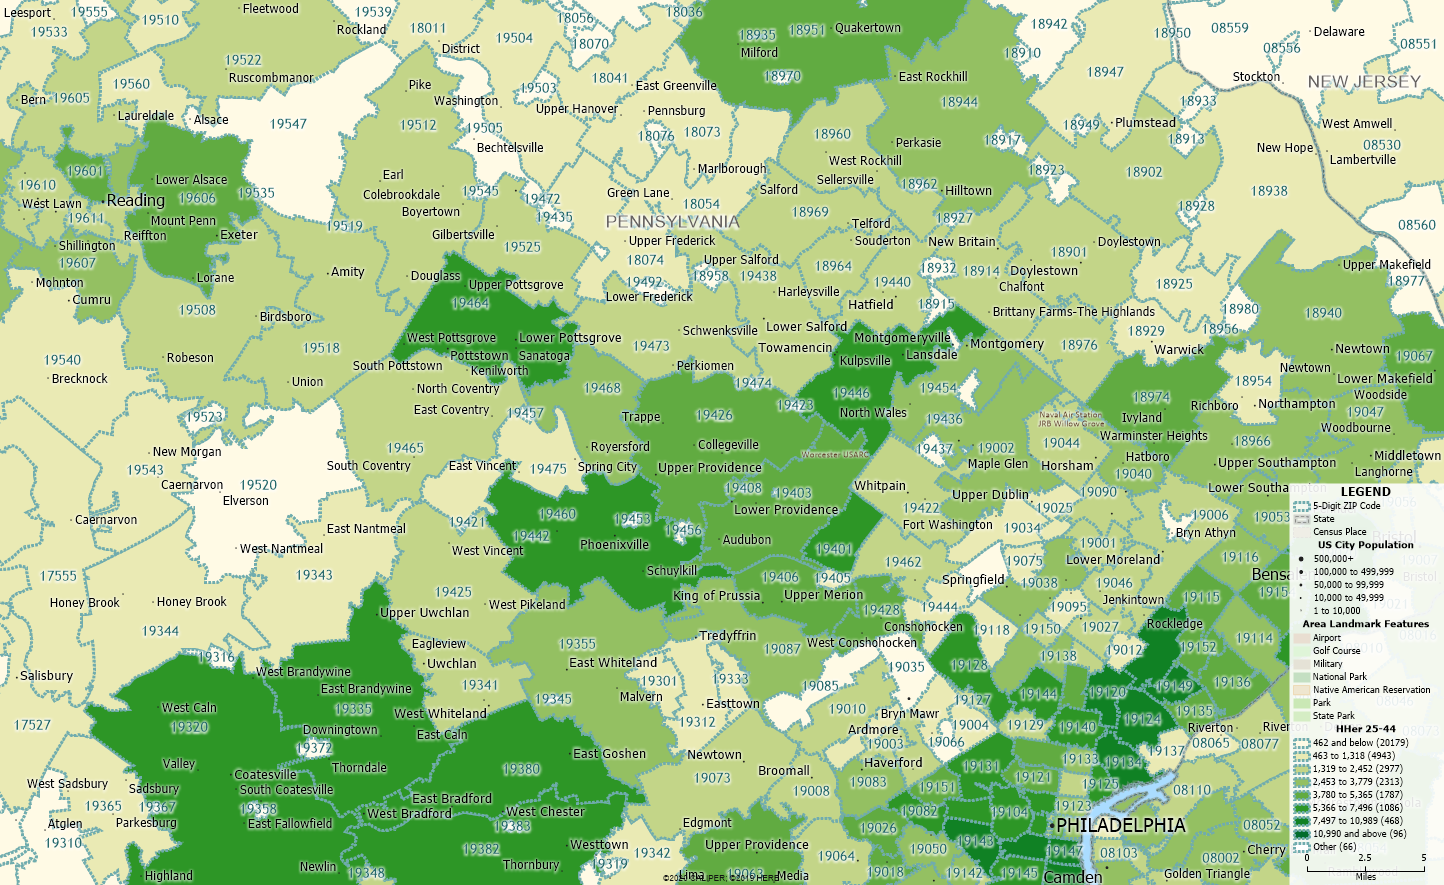
Homeowners between 25-44 years-old
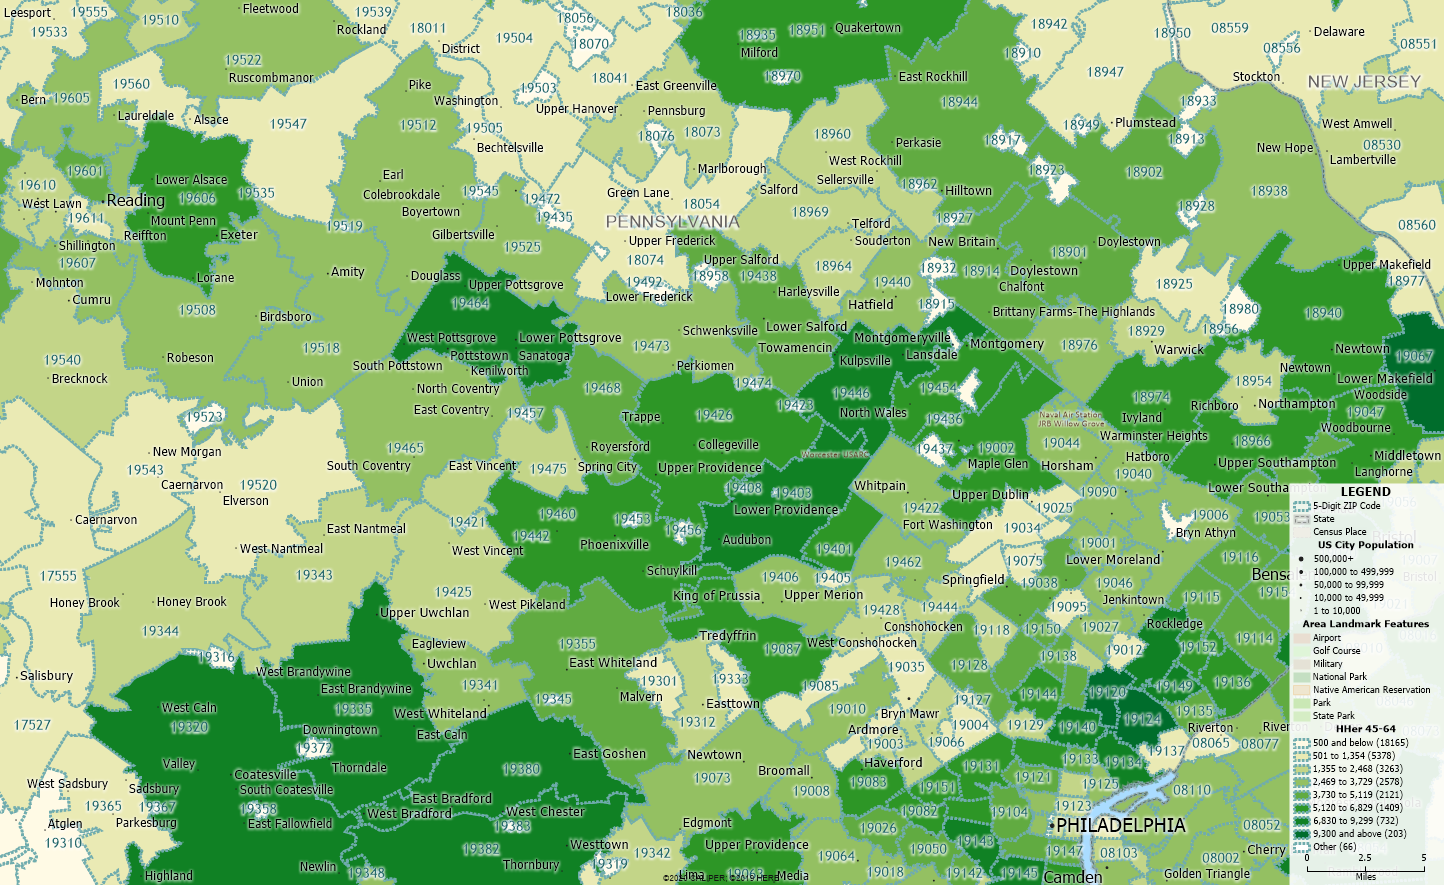
Homeowners between 45-64 years-old
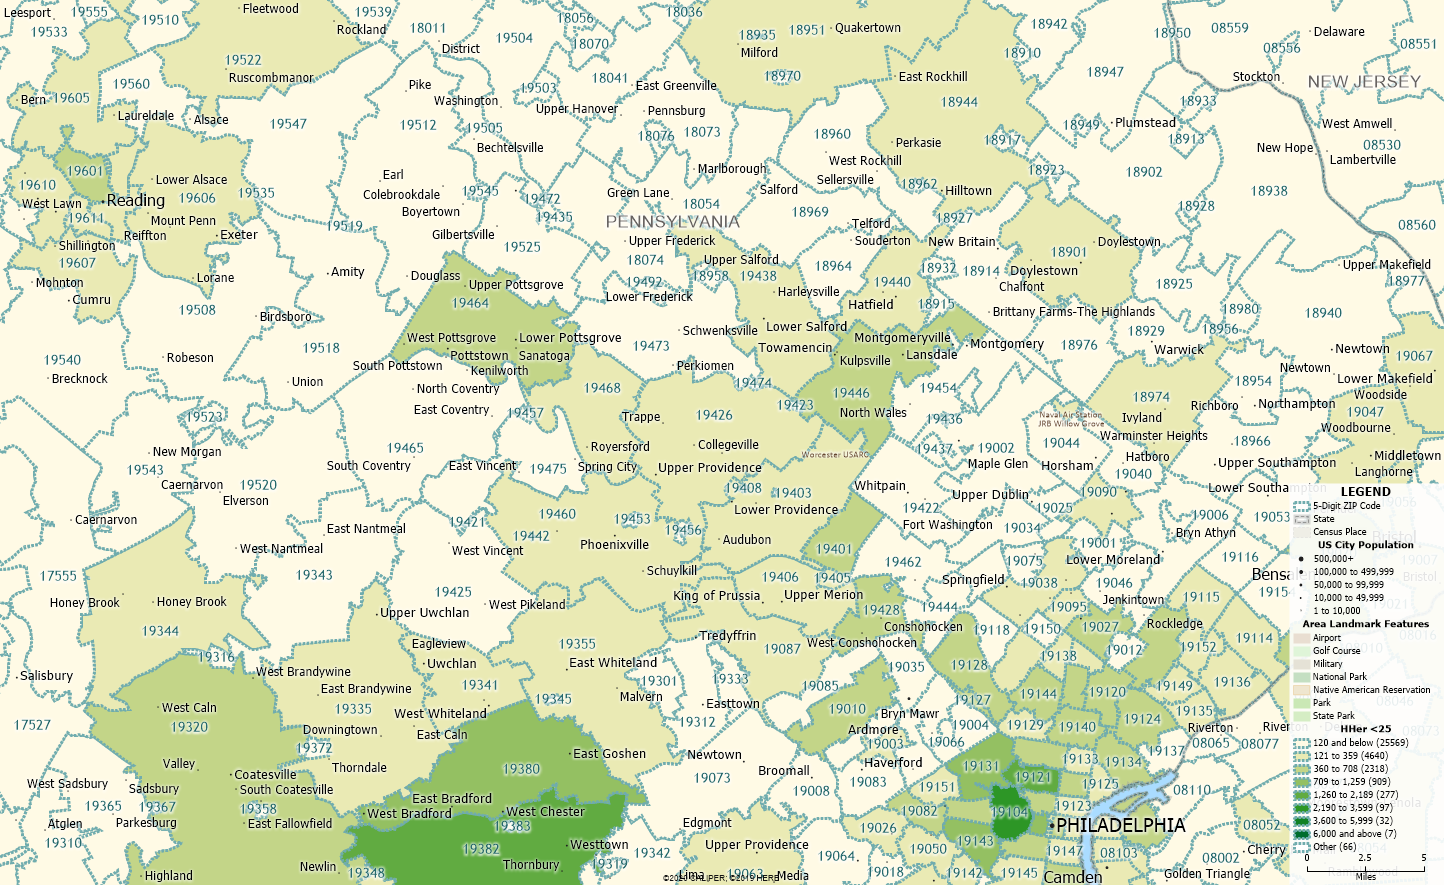
Homeowners under 25 years-old
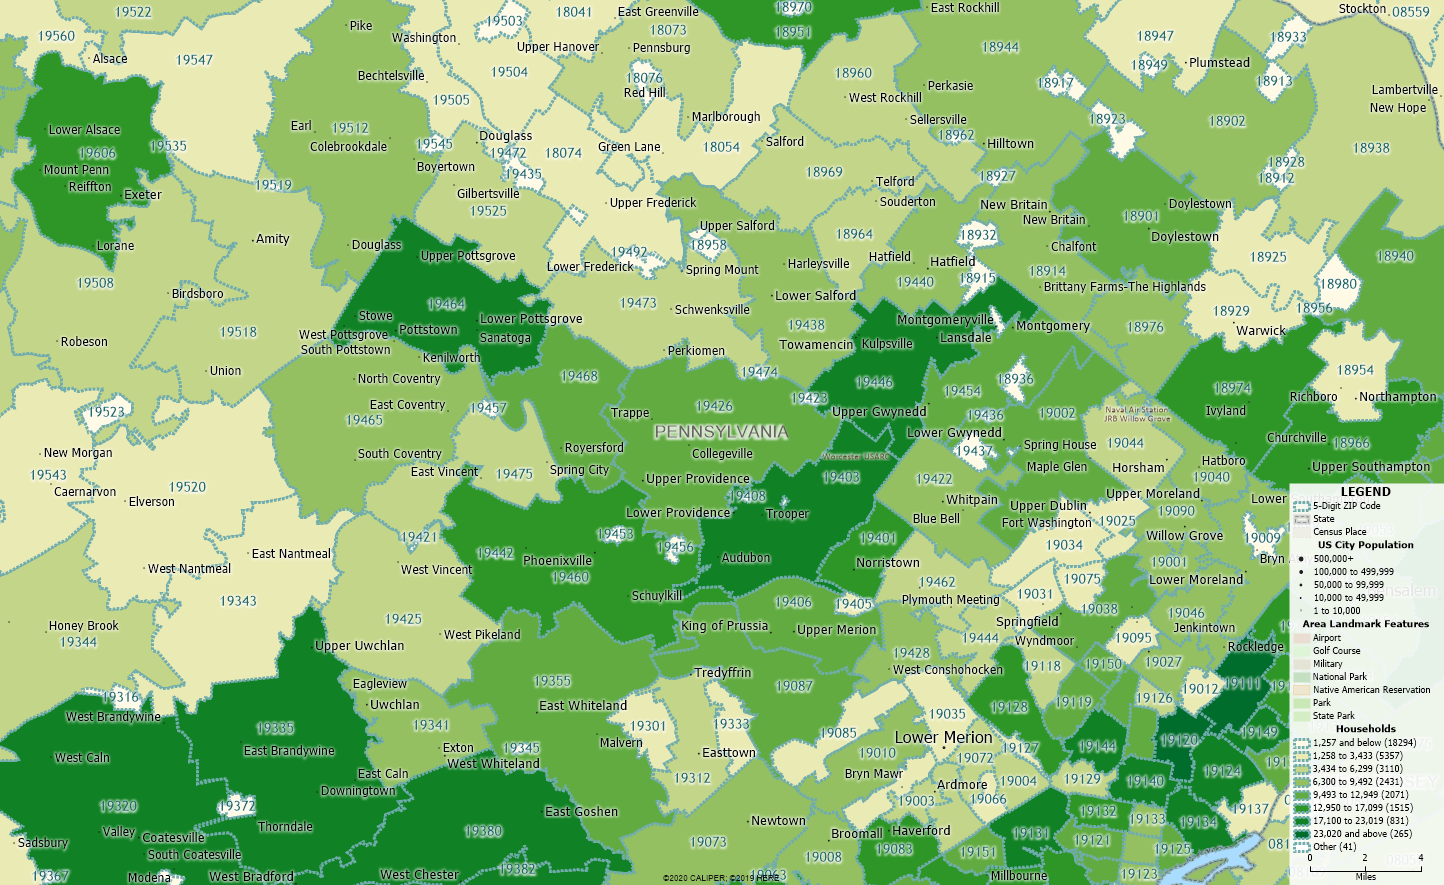
Households
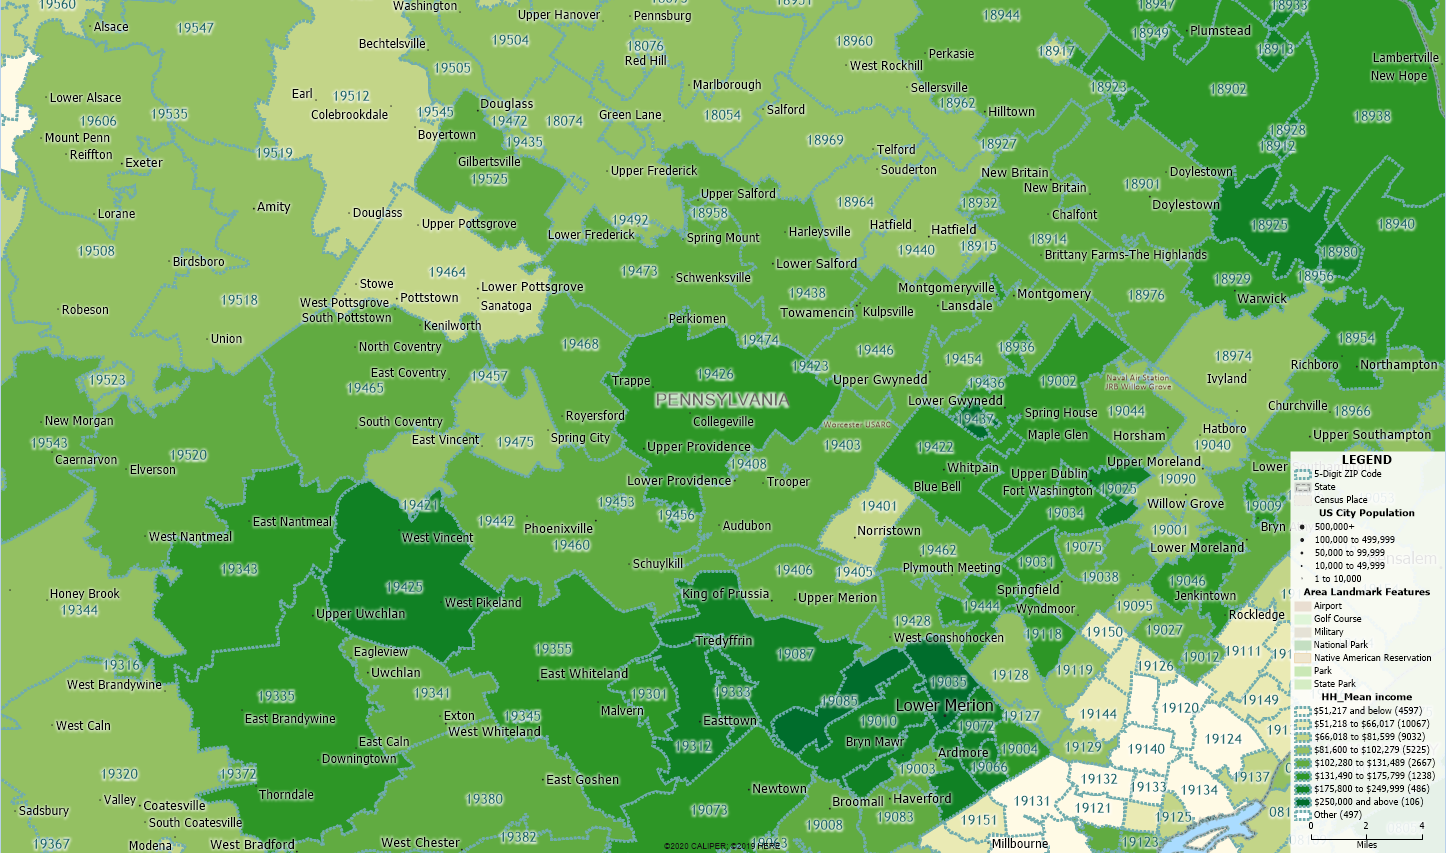
Average Income
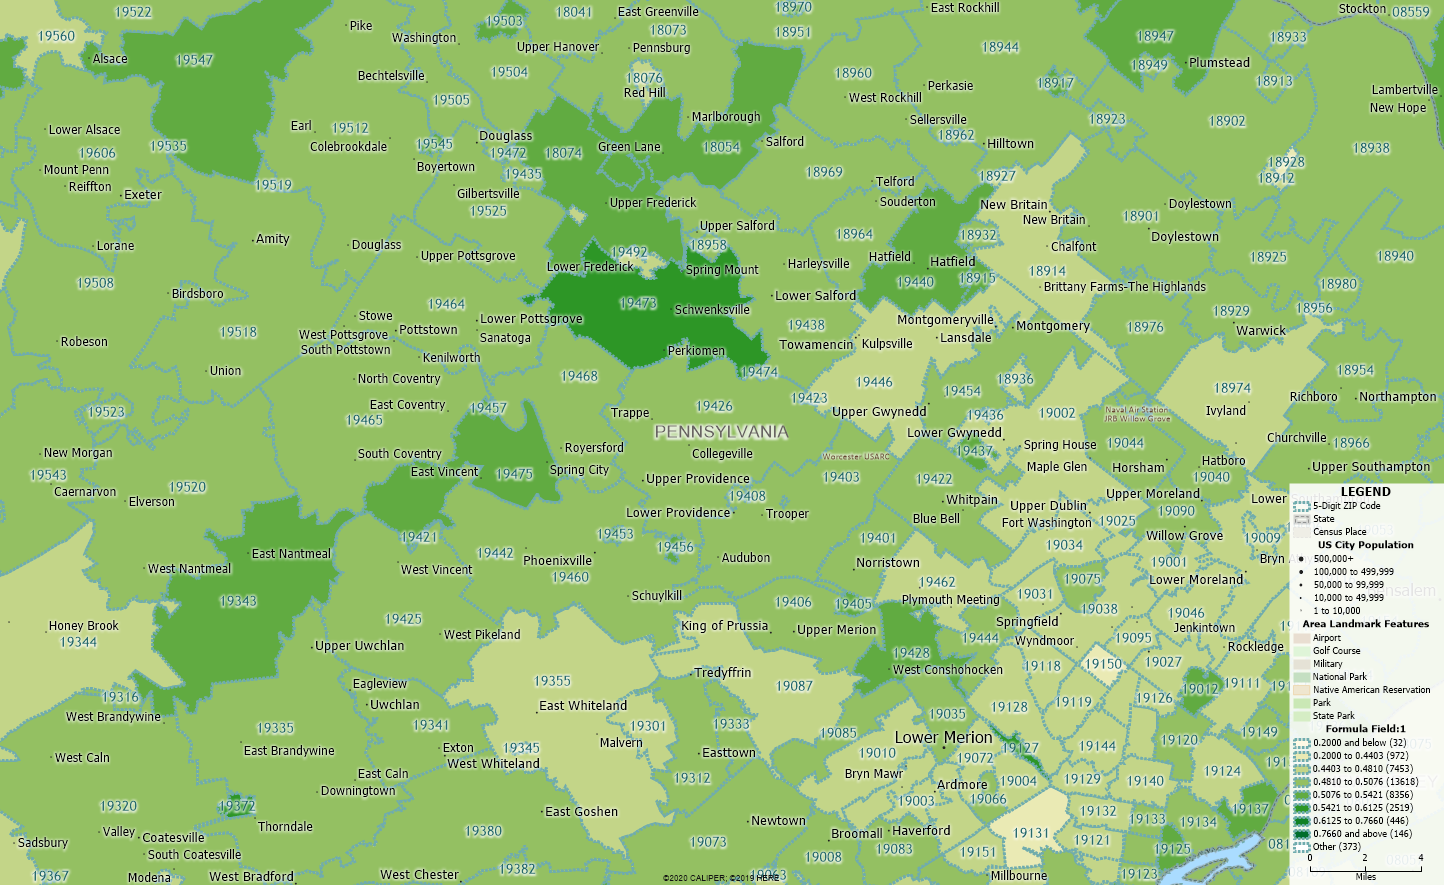
Men vs. Women
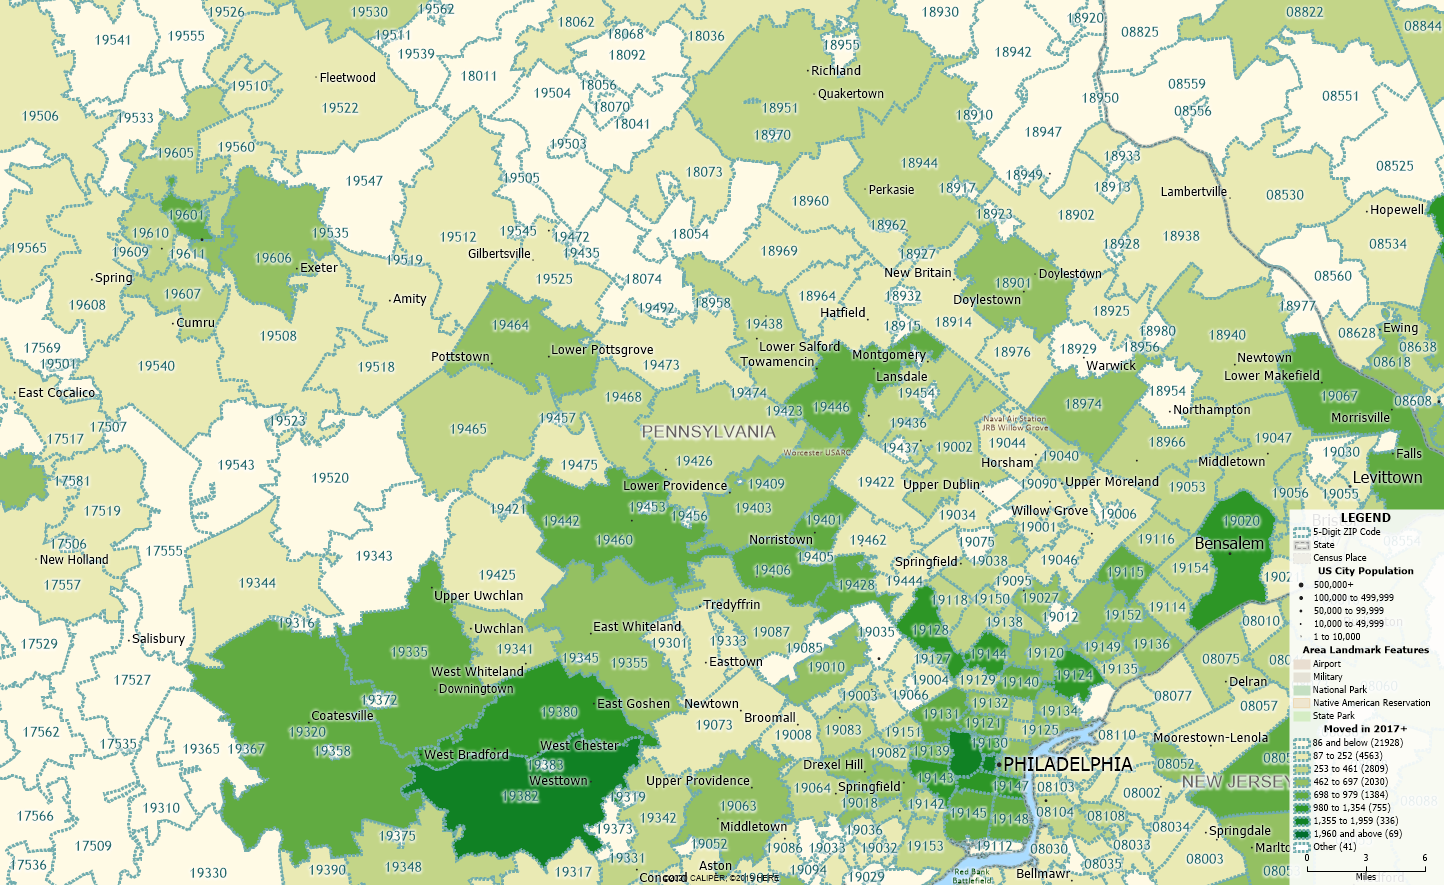
Moved since 2017
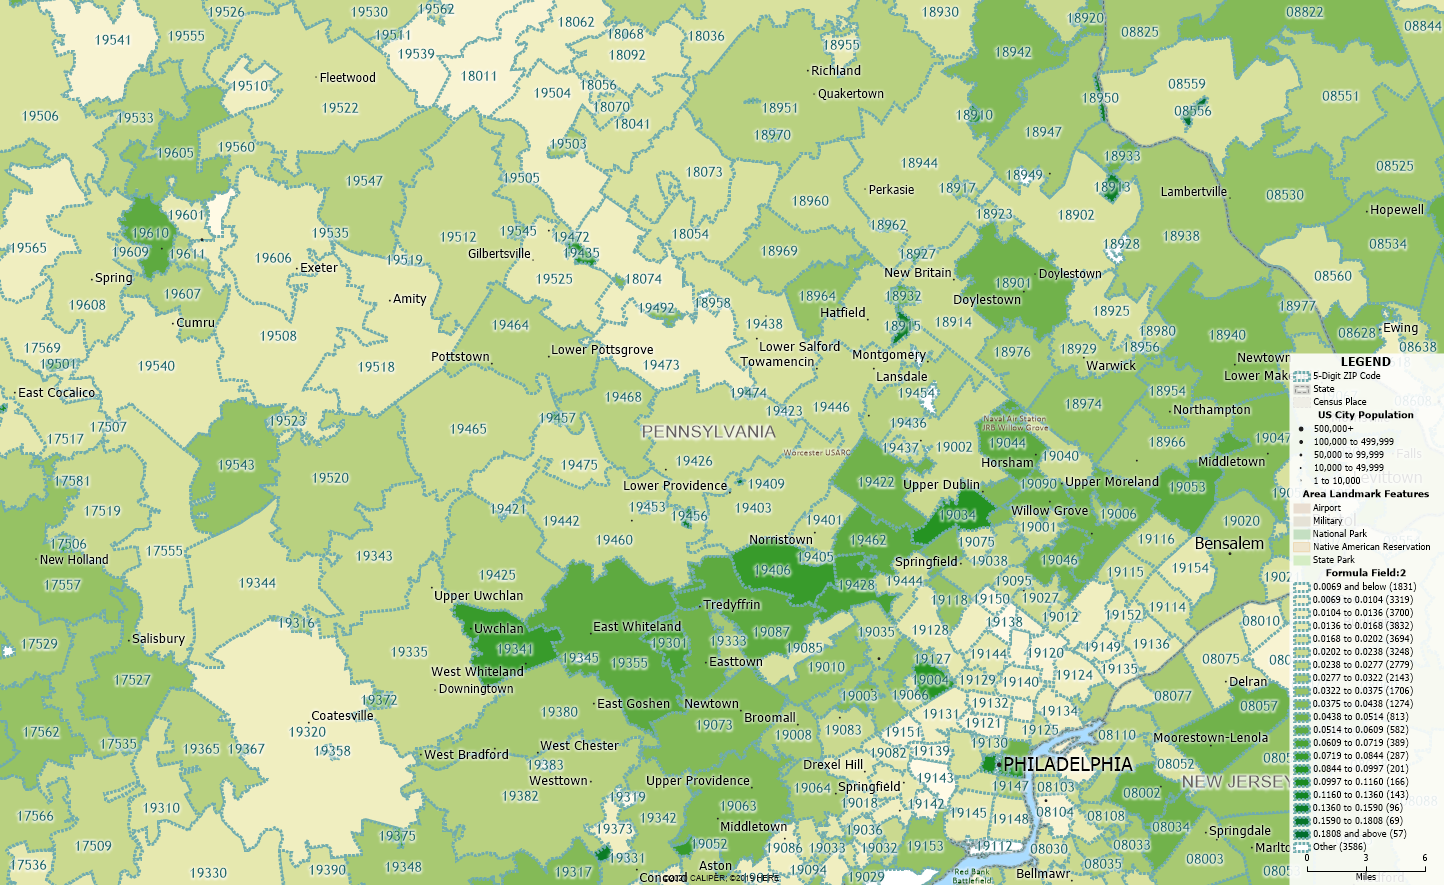
Business Density (Number of businesses divided by population)
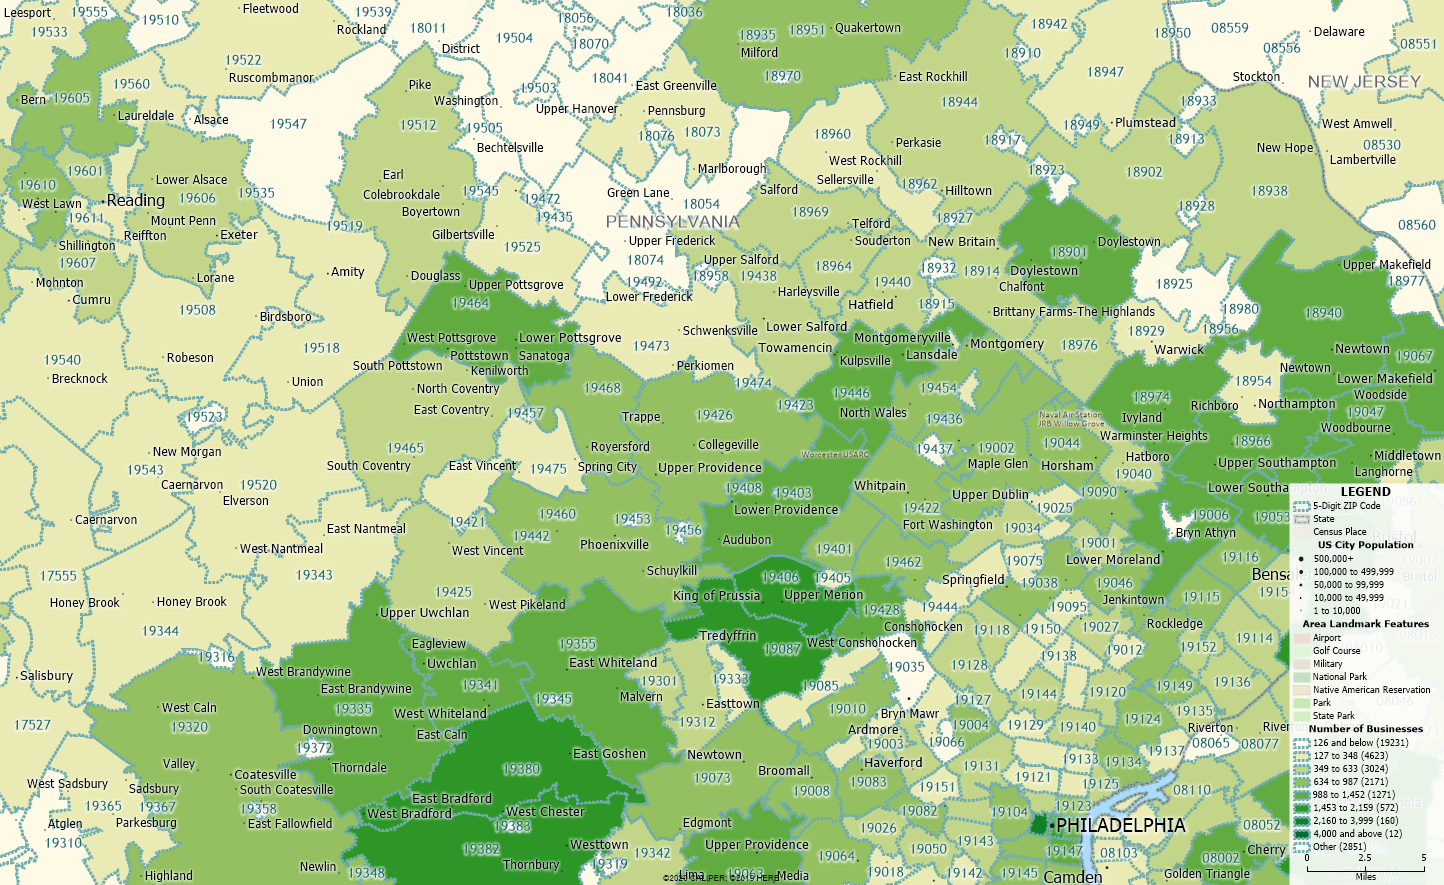
Total Businesses
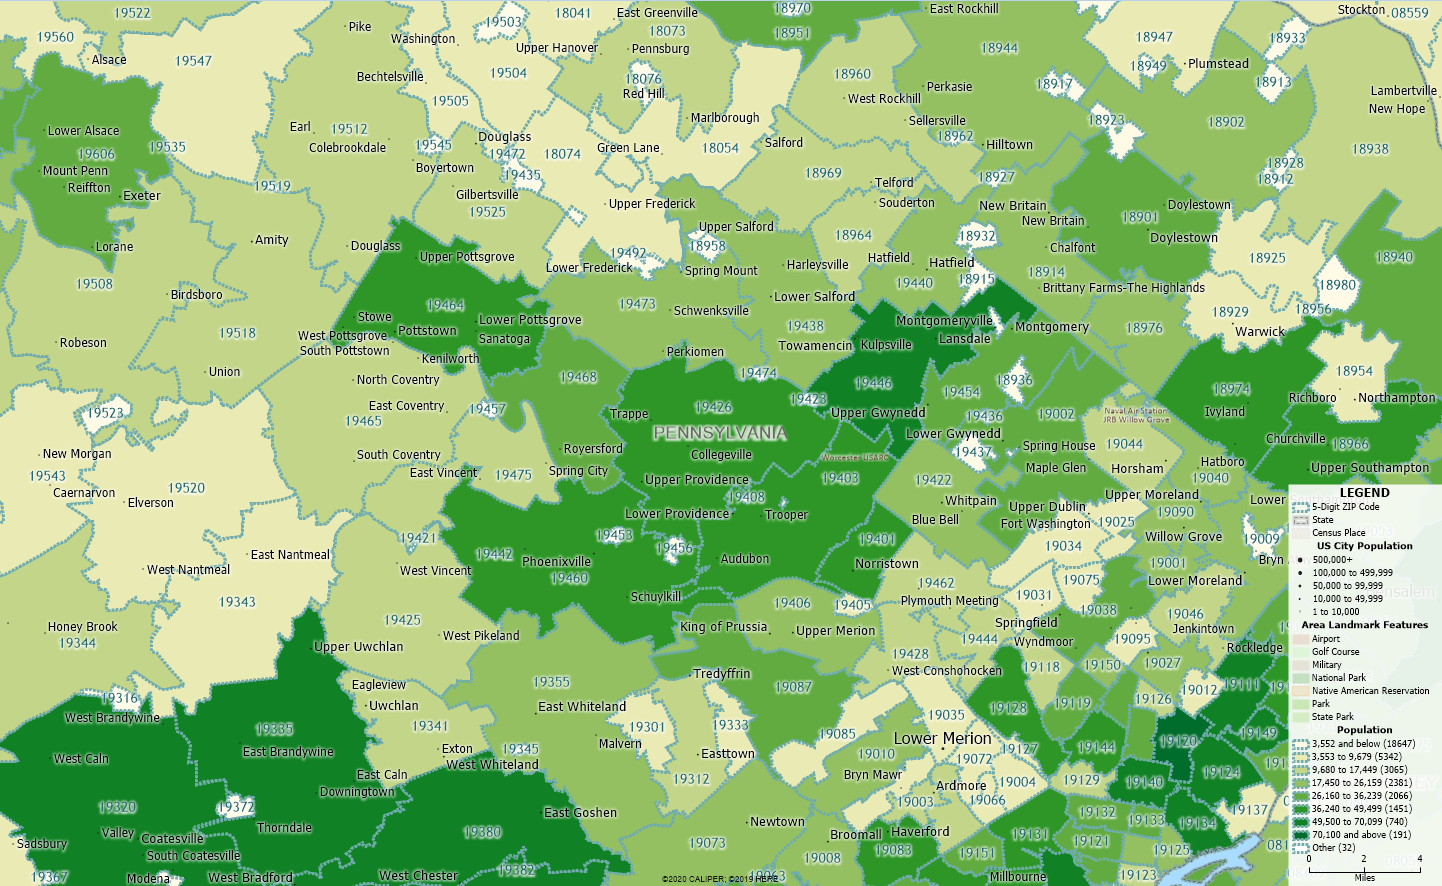
Population
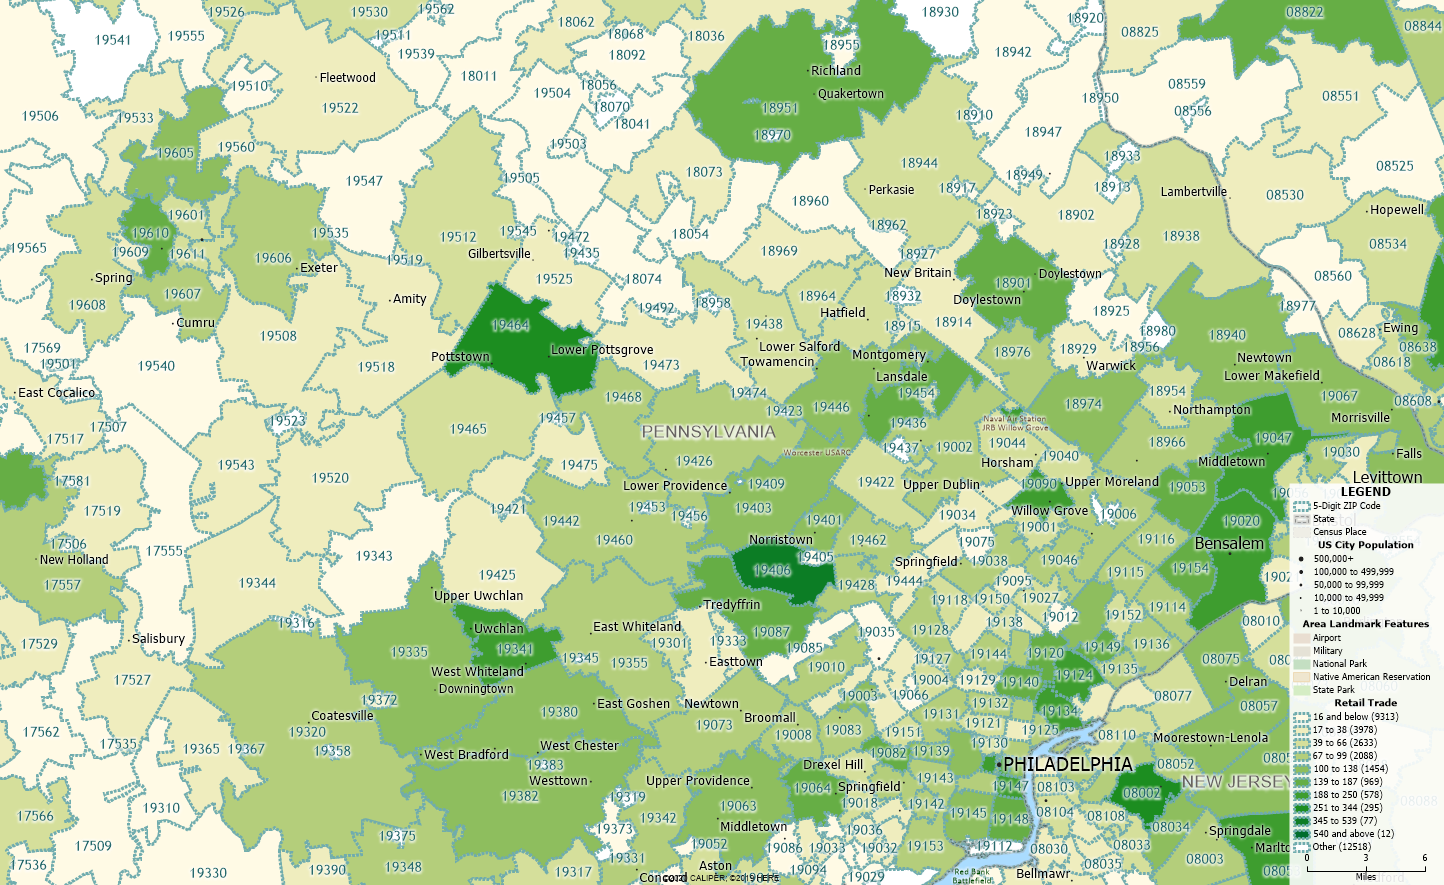
Retailers
A few random things I learned from this exercise:
- There’s a huge density of young people and senior citizens in the Villanova, and not a lot in the middle. The older people are well off with expensive homes and the younger people are renting with roommates.
- Schwenskville and Spring Mount have a higher-than-average number of males vs. females living there. Is there a reason for that?
- People are moving to West Chester. It’s still a fast-growing area and the expansion is encroaching on Downingtown and Coatesville. This is also the area more young people are buying than older people (affordable!)
There’s a ton more but just wanted to share that for now.
I think it would be really cool to start building personas off that demographic data (“Meet Billy Westchester the 25-year-old home owner”), or explore how google keywords rank compared to some of these demographics (“hey, there’s only one listing that comes up when I google ‘Schwenksville Dentist’ even though my dentist office is just a mile away in another town”), etc.
I might do a follow up post exploring those another time. For now though, if you have any insights that YOU found in your town, please share them with me!

